3 Easy Steps to Decode Vibration Frequency Charts

Choosing the right motor can seem hard, but Vibration Frequency Charts help. These charts work like a guide, showing how a motor operates in different situations. By learning to read them, you can spot problems like excessive shaking or patterns that cause trouble before they cost you money.
A simple 3-step method can help you understand these Vibration Frequency Charts better. Studies show that learning this way increases accuracy quickly, from 79.4% to 88.4% in just a few days. For certain frequencies like 200 Hz, results improve even more. With this guide, you’ll feel confident about selecting motors that fit your needs and avoid common errors.
Key Takeaways
Understand vibration frequency charts to see how machines work. This helps find problems early.
Look at frequency ranges and amplitude levels to check machine health. Knowing this can stop expensive repairs.
Compare motor details with chart data for safe use. Stay away from resonance peaks to make motors last longer.
Check vibration frequency charts often to know machine conditions. Regular checks stop sudden breakdowns.
Use tools like vibration charts and ISO rules for better accuracy. Trust your research to make good choices.
1. Understand Vibration Frequency Charts
Definition and Purpose
Vibration frequency charts are important tools for studying vibrations. They show how machines act in different situations. These charts give details about vibration levels, frequencies, and patterns. This helps find problems in equipment like electric motors early.
Here’s a simple explanation of their purpose:
Term/Concept | Meaning |
|---|---|
Vibrations at certain frequencies help find issues like misalignment. | |
Frequency Response | Shows how a system reacts to forces, helping with detailed analysis. |
Frequency in Orders | Adjusts frequency data by machine speed for easier comparison. |
Using these charts can stop problems before they grow, saving time and money.
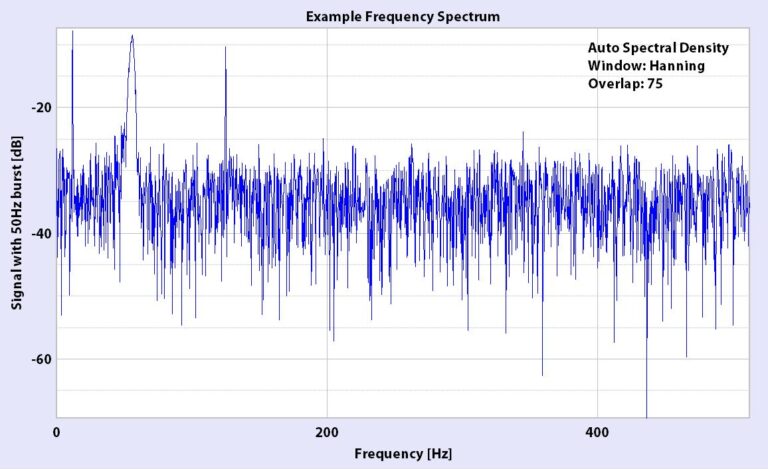
Parts of a Vibration Frequency Chart
A vibration frequency chart has key parts that give useful information:
Frequency Axis: This shows the range of frequencies, measured in Hertz (Hz). It helps spot vibration patterns.
Amplitude Axis: This shows how strong the vibration is. Bigger amplitudes often mean bigger problems.
Resonance Peaks: These peaks show where the system vibrates too much, often due to resonance.
Each part helps monitor machine health. For example, stress response and wave movement explain how vibrations spread. Knowing these parts helps you read the chart better.
Why It Matters for Motor Selection
Vibration frequency charts are very helpful when picking a motor. They help match the motor's performance to the system's needs. For example, ISO 10816-3 gives rules for safe vibration levels in motors. Comparing chart data to these rules ensures smooth motor operation.
These charts also help avoid mistakes, like picking a motor that vibrates at the system's natural frequency. This careful planning makes machines last longer and work better.
2. Find Important Information in Vibration Frequency Charts
Why Frequency Ranges Matter
Frequency ranges show how vibrations affect machines and structures. Different frequencies cause different problems, like small wear or big damage. For example, ISO 10816-3 says high frequencies can weaken structures, while low ones may cause resonance. Checking these ranges helps you see if a motor vibrates safely or needs fixing.
Vibrations are made of complex parts like frequency, amplitude, and phase. These details are important for keeping machines working well. If you know the frequency ranges, you can stop harmful vibrations and make motors last longer.
Amplitude and Machine Health
Amplitude shows how strong vibrations are. It’s a key sign of machine health. A vibration severity chart helps you understand amplitude levels. ISO 10816-3 gives rules to check if vibrations are safe for motors.
Different ways to study amplitude include:
Method | What It Does |
|---|---|
Time domain | Tracks vibration strength over time to find problems. |
Frequency domain | Matches vibration strength to frequency for better analysis. |
Joint domain | Combines data for a full view of vibration patterns. |
Modal analysis | Predicts how changes affect vibration and machine performance. |
These methods help find strong vibrations early and fix them before damage happens.
Spotting Resonance Problems
Resonance happens when a system vibrates too much at its natural frequency. This makes vibrations stronger and can harm machines. Finding resonance patterns in charts is key to stopping these issues. Tools like ZERONE mix vibration data with images to find resonance linked to bearing problems. Studies show adding extra data improves accuracy.
To find resonance, look for sharp peaks in the chart. These peaks show where vibrations are amplified. Fixing these problems early keeps motors running well and avoids expensive repairs.
3. Use Vibration Frequency Charts for Choosing Motors
Matching Motor Data to Chart Information
To pick the right motor, match its details to chart data. First, find the motor's working frequency range. Compare this to the chart's frequency axis to check safety. Look at the chart's amplitude levels to see if they fit the motor's vibration limits. For example, ISO 10816-3 gives rules for safe vibration levels. Use these rules to ensure the motor works well without damage.
Watch for resonance peaks. If the motor's natural frequency matches these peaks, vibrations may grow stronger. This can cause failures. Pick a motor with a frequency range that avoids these peaks for smoother performance and longer life.
Avoiding Motor Selection Errors
Choosing the wrong motor can cause expensive problems. A common mistake is ignoring vibration data. Skipping this step might lead to picking a motor that can't handle the system's vibrations. Another error is not checking the system's natural frequency. This can cause resonance, harming the motor and other parts.
To prevent these issues, always compare the chart data with the motor's details. Use tools like vibration severity charts to check if the motor fits. Following ISO 10816-3 rules helps avoid mistakes and keeps the motor running safely.
Tips for Better Choices
Making smart choices improves motor selection. Studies show confidence helps with better decisions. Spend time studying vibration charts to feel more sure. Experts take extra time to review options, leading to better results. Do the same by carefully checking chart data against motor details.
Trust your research and use tools like vibration software to confirm your pick. Confidence grows when you mix good research with helpful tools. This method improves accuracy and ensures the motor fits your system's needs well.
Understanding vibration frequency charts is easy with three steps. First, learn the chart’s parts. Then, find important details like frequency and amplitude. Lastly, compare the chart data to motor details for better choices.
🛠 Pro Tip: Use tools like vibration severity charts and ISO rules to stay accurate.
Follow these steps to pick motors confidently and avoid big errors. Use this method as a guide for future tasks. With practice, you’ll get better at reading charts and making smart choices every time.
FAQ
How should I start reading a vibration frequency chart?
First, find the frequency and amplitude axes on the chart. These show vibration patterns and their strength. Check for resonance peaks to catch problems early.
How do these charts help pick the right motor?
They explain how motors handle different frequencies and amplitudes. Comparing the chart with motor details avoids resonance and keeps things running smoothly.
Can I use these charts for other machines?
Absolutely! These charts work for many machines, not just motors. They help find problems, track health, and boost performance in various systems.
What tools help analyze vibration frequency charts?
Try tools like vibration severity charts, ISO guidelines, or software like ZERONE. These make it easier to study data and find vibration issues.
How often should I review these charts?
Check them regularly. Monthly reviews are good, but important systems might need weekly checks to stay in top shape.
🛠 Pro Tip: Use reminders to check charts often and avoid expensive repairs.
See Also
A Comprehensive Guide to Calculating Vibration Frequency and Amplitude
Quickly Grasping the Essential Concepts of Vibration Analysis
The Definitive Resource for Accurate Vibration Measurement Techniques
Effective Strategies for Diagnosing and Addressing Motor Vibration Issues
Get Custom Micro DC Motors from
INEED Motors!
Leading Brand in Vibration Motor Manufacturing Industry